
Are we measuring China's GDP wrong?

Bullets:
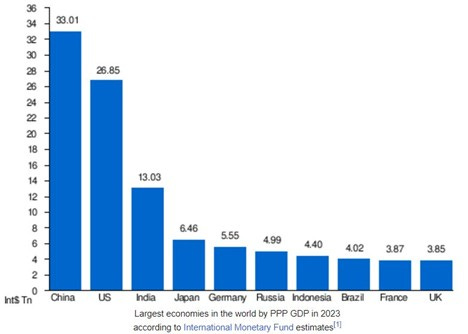
The United States has the largest economy in the world, by traditional GDP measures.
But when adjustments are made to account for Purchase Price Parity, and the cost differences for similar products, it is China with the largest economy.
The United States has a giant services sector, and includes careers that have no equivalent in other countries. The massive legal, finance, insurance, real estate brokerage, and lobbying industries are far larger in the US than in any other country.
When economists remove those sectors from the calculation of GDP, the result is "Productive GDP", and involves accounting only for the production of tangible products in the economy.
Report:
Good morning.
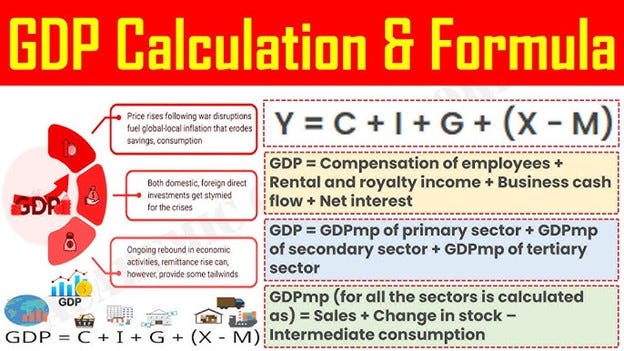
When we compare the economic strength of countries, we tend to look first at GDP. Gross Domestic Product is the “total market value of finished goods and services produced within a country’s borders during a period or time.” Already, you can see it’s complicated. For example, the output from a factory owned by Japan, but in the United States, would count toward US GDP, because it is within US borders, but Toyota would be earning the money. Won’t get into it, but the definition of “finished goods” is also complicated. Here is the formula for the calculation, which we won’t get into either:
But there are other pretty obvious problems with this calculation too, which is that the monetary value of something in one country is different from that same product or service in another country, even if the product is identical. Let’s do the cost of going to the dentist, the difference between a visit to the dentist in the United States, compared to a dentist visit in China.
We will compare apples to apples best we can. Getting your teeth cleaned in the US is $75 to $200. In China a dental cleaning is about $18. Fillings in the US is $75 to $250, China is $44. In the US, a crown will run $1000 to 1500, and in China it’s around $450. In China there isn’t really dental insurance to speak of, everything is out of pocket, and we’ll come back to that part later.
So that’s a trip to the dentist. Let’s book a downtown hotel in New York City, and do the same for Shanghai. We’ll do the same days, Monday 2 June through Monday 9 June. We’ll also pick the same hotel chain, Park Hyatt. Park Hyatt New York is 5 star, and $1182 per night. Park Hyatt Shanghai, 5 stars, same dates, is $286 per night. But a business traveler staying in New York City is somehow contributing more than four times to the GDP of New York, and the United States, than a business traveler to Shanghai, staying in an almost identical 5-star property.


The cost to attend a top university in the United States is tens of thousands of dollars more than a top university in Europe, and especially compared to Asia. But it all adds up to a higher GDP in the United States.
Economists try to work through these deficiencies, because measuring GDP in this way leads us to make conclusions that shouldn’t be made. Purchasing Power Parity is one solution to this problem, so analysts make better apples-to-apples comparisons. And by comparing Purchasing Power Parity GDP, the charts suddenly look very different.
This is something we know intuitively. Someone earning $100,000 a year in New York City is barely paying his bills, but someone earning $100,000 a year in a smaller town a hundred miles away is probably doing fine, because everything costs less. That’s how purchasing power parity works—it compares what similar things cost.
But there are three other major problems with GDP, and the way in which we calculate it. The first problem is here, which involves imputations. Economists in the United States assign values based on estimates for market values, for a lot of economic output that is not actually produced or traded. One of them is the “imputed rental of owner-occupied housing”. Here, economists take all the owner-occupied housing in the United States, and estimate what the rent for all those properties would be. If you live in a home that you own, and were charging yourself a market rent, how much would you be paying yourself? And we include that number—population wide—in US GDP. A second example is health insurance provided by employers, again, if you had to buy it yourself, on the open market, what would that be worth? Add up those and other “imputations”, and that adds up to about 14% of US GDP, about $4 trillion in 2023.
In China, and in most other countries, those imputations don’t exist. If there are no actual cash flows to count, it doesn’t get put into their GDP figures.
The second point relates to how far our dollars actually go in the market, compared to elsewhere. Construction spending is a major component to GDP, both in the US and in China. $1.1 trillion in the United States, and $1.2 trillion in China. About the same, then. But it’s not really the same at all. China produced 1.3 billion tons of steel in 2022, compared to 97 million tons in the US. China builds lots of high-speed rail, and the US famously doesn’t build any. Tens of thousands of apartment buildings, bridges, highways, airports, ports—almost all of them were built in the past twenty years, all paid for, supposedly, with the same notional dollar value that we spend in the US where we did not do those things.
The third problem is the comparisons of our services sector. China has four times the population of the United States, but has fewer than half as many attorneys. The US has more than five times as many accountants. 15 times as many investment advisors. The American lobbying industry in the United States has no real equivalent anywhere else in the whole world, let alone China. And all these jobs are highly paid in the US—there many more people working in these jobs, at far higher pay. That translates into more lawsuits, insurance premiums, auditing work, crafting and enforcing legislation that make all those lobbyist jobs worth the money they’re paid, and so on. Whether or not that contributes anything meaningful is a good question, but they all count toward US GDP in a way that is unique to any other economy in the world.
So what if we took all these service sectors out of the GDP calculation entirely, and looked instead at productive GDP. How many actual products, tradable goods, are being produced? Were we to exclude the components of GDP such as financial services, insurance, legal and lobbying, how do things look now? First, again, we have GDP calculated in the traditional way, with all the imputations and dollar cost problems. Then this one is by Purchasing Power Parity, which suddenly looks very different.
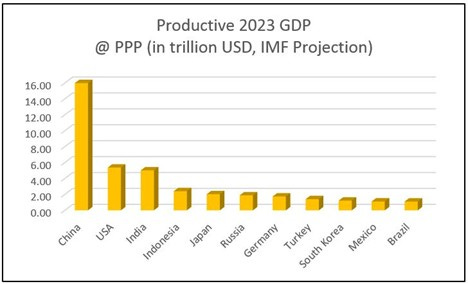
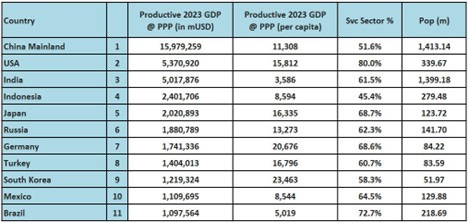
But measuring Productive GDP means that China’s economy is three times the size of the United States. In fact, China’s economy is bigger than the next four combined. The UK and France go away completely, out of the top 10. Indonesia moves ahead of Japan. Turkey comes in at #8, and Turkey didn’t show up in the top 10 in either GDP or in Purchasing Power Parity.

Counting GDP this way, differently, by productivity, puts these other statistics into sharper focus. For years China has led the world in patents, these are data from 2021, and in all these fields where you see a big red piece of pie, that’s China. Overall it’s 38% of all the patents, and China is by far the biggest piece of all these industries. A massive productive economy means massive levels of port activities—raw materials inbound, finished products shipped out.

Seven of the top 10 busiest ports in the world are China. Factories require lots of energy to run, and China consumes more electricity than the US, India, Russia, Japan, and Brazil, and Canada combined.
These are questions that economists are struggling with, and they’re the same questions faced by anyone who’s lived here awhile, and just looked around. Entire factory zones were built for the same notional dollar value as a single factory in the US or Europe. China builds entire metro lines—whole subway systems—for about what we spend to build a new subway station.
We’re measuring everything wrong, and we believe things that aren’t true.
Resources and links:
Average Cost of College By Country
https://educationdata.org/average-cost-of-college-by-country
10 Cities Where $100k Is Worth the Least
https://smartasset.com/data-studies/100k-worth-2025
China’s Shocking Worldwide Economic Dominance Revealed
China vs US GDP Comparison and What It Says About Their Respective National Power
New York Times, You Need $100,000 a Year Just to Get by Here
https://www.nytimes.com/2023/05/01/nyregion/you-need-100000-a-year-just-to-get-by-here.html
The World’s Busiest Ports
https://www.rferl.org/a/29637065.html
Hotel stays data from Trip.com
When last did we read, see or hear anything in the media about US - China relations, which did not blithely proclaim the global predominance of America’s economy. Bigger than most of the world’s economies combined, we’re told?
Almost never, is the answer.
Which is why Walmsley’s article on how we ought to measure China’s GDP is so timely. Lucid, eye-opening for some, fact driven and usefully referenced. Do yourselves a favour and read it.
I think that the old adage, "let sleeping dogs lie", comes to mind. The USA is striking out at all countries across the world, and especially at China (i.e., closest 'competitor'). This GDP analysis only makes the American policy makers and leadership more upset (or angrier), and that is not a good thing when you are dealing with a rabid Rottweiler (aka. USA).